Provided by: Spring 2013 Sampling Methods Class: J. Bruland, M. Dybala, N. Gunther, A. Hoffman, J. Jones, L. Kelley, J. Neidinger, M. Olszewski, C. Rogers, A. Waldron Department of Biology, Hood College, 401 Rosemont Avenue, Frederick, MD 21701
Methods
Lake Depth:
We recorded both the soft and hard bottom measurements throughout Culler Lake. Soft bottom measurements are the depths from the water surface to the top of the sediment layer. Hard bottom measurements are the depths from the water surface to the constructed base of the lake bottom, as indicated by a section of PVC pipe being forced as deeply as possible into the sediment. The difference between these two measurements is an indication of the depth of the sediment. Depth readings were recorded over eleven transects spanning the length of the lake. GPS was used to record five to seven waypoints along each transect.
Inflow and Outflow Measurements:
To measure the flow of water into and out of Culler Lake, several readings were taken. We measured the flow at the input pipe from Carroll Creek. The outflow was measured where the lake waters re-enter Carroll Creek. The water flow was recorded in feet per second. To calculate cross-sectional area, we also measured pipe diameter, the maximum water depth, and the width of the waterline within each pipe.
Creating Maps:
We created maps using data collected from Culler Lake and geographical information systems (GIS) software.
- A base map of Culler Lake was downloaded from ESRI’s ArcOnline World Imagery server.
- The lake shoreline was drawn to provide a baseline reference for subsequent data addition.
- The locations of depth measurements were determined using a hand-held global positioning system (GPS) Some points were not correctly recorded by the GPS unit and later had to be plotted in relation to where they were drawn on a field map.
- Using soft- and hard-bottom lake depths, depth contours were hand-drawn for each map.
- Using these maps as a guide, we created GIS-based maps for both soft- and hard-bottom contours.
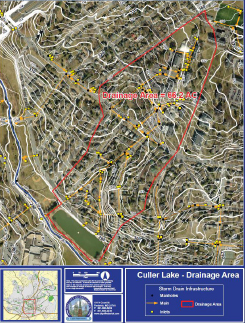
Figure 1. Map of stormwater drainage into Culler Lake. The red line indicates that drainage area. The yellow lines and symbols denote drains and underground piping for stormwater. Note that a portion of this area collects water for Culler Lake and that a portion of the stormwater is discharged directly into Carroll Creek.
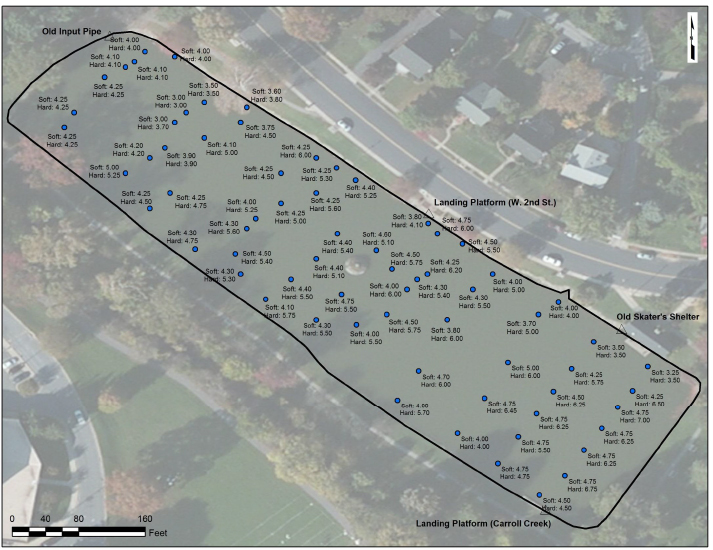 Figure 2. Map of Culler Lake indicating sampling points and their cooresponding soft and hard bottom water depths.

Figure 3. Map of Culler Lake indicating the current depth contours (i.e. the soft-bottom depth).
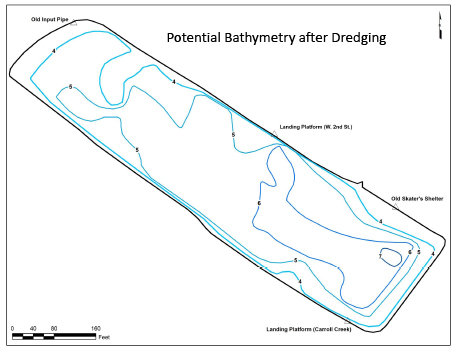
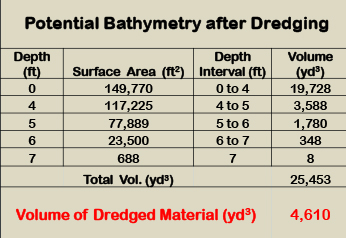
Figure 4. Map of Culler Lake indicating potential contours after dredging (i.e. the hard-bottom depth).
Lake Volumes:
Weight to area ratios for cut-out lake maps were used to determine lake surface area and that of each contour ≥ 4 feet. These were measured against a standard to calculate surface areas in ft2. Segment volumes for each depth stratum were then calculated using the equation below and summed for the volume of the entire lake.
V = h/3 [A1 + A2 + √(A1*A2)],
where V = volume of stratum; h = depth of stratum, A1 = area of the upper limit of the stratum; and A2 = area of the lower limit of the stratum.
Results
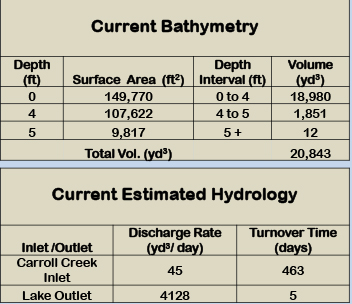
Current Culler Lake Hydrology
- The majority of the sediments are deposited in the southeastern two-thirds of the lake.
- There was a large discrepancy between lake outflow and Carroll Creek inflow during a non-storm period.
- The shallow nature of the lake may allow sediment re-suspension due to winds.
Implications
Dredging Culler Lake
The volume of dredged sediments, 4,610 cubic yards, would require approximately 500 truckloads of material to be removed (based upon an 9-10 cubic yard truck capacity).
- Dredging could reduce total suspended solids at the lake outlet by reducing resuspension of sediment.
- Given the range of current turnover time estimates, it is difficult to approximate water residence time increases after dredging.
- There are likely to be temporary negative aesthetic and recreational impacts during the dredging.
Acknowledgements We would like to thank Friends of Baker Park and the Frederick City Departments of Public Works and Parks & Recreation for their help with this project.